Click here to download a PDF copy of this Issue Brief
Highlights
- Among undergraduate veterans who enrolled in postsecondary education for the first time in 2011-12, 33% reported a disability, compared to 15% of non-veterans who are financially independent of their parents.
- Two-thirds of veterans with a disability were enrolled in public institutions (67%).
- Veterans with a disability are more likely than their non-disabled counterparts to be enrolled in associate degree programs rather than bachelor’s degree
- Almost half (47%) of veterans with a disability who began as first-time students in 2011-12 had left without completing by 2017, higher than veterans who did not report disabilities (39%) and 7 percentage points lower than non-veteran independent students reporting disabilities (54%).
- Veterans with disabilities in this cohort completed their degrees at a lower rate than non-disabled veterans. However, both veterans with a disability and their non-veteran disabled counterparts had earned bachelor’s degrees at similar rates by 2017.
Methodology
The U.S. Department of Education’s Beginning Postsecondary Students (BPS) is a longitudinal survey that follows a cohort of students who enrolled for the first time (beginning) in postsecondary education in 2011-12. These first-time postsecondary students in BPS:12/17 participated in three interviews: in 2012, at the end of their first year in postsecondary education; in 2014, about 3 years after they started postsecondary education; and in 2017, approximately 6 years after they started postsecondary education. Veterans with a disability in this analysis were identified based on their self-reported status in the 2011-12 base-year of the survey; the data do not indicate if the disability is “service-related.” BPS asked respondents four disability related questions: (1) are you deaf or do you have difficulty hearing; (2) are you blind or do you have a serious difficulty seeing even with glasses; (3) do you have a serious physical, mental, or emotional condition that causes serious difficulty concentrating, remembering, or making decisions; and (4) do you have serious difficulty walking or climbing stairs.
Veterans more closely resemble older students, rather than individuals who enroll in college right after high school. As a result, when comparing veteran and non-veteran students, we report on non-veteran independent students who are not reliant on their parents for financial support.
Disability’s Workforce Impact
According to Bureau of Labor Statistics, about 4.1 million veterans served in the military after September 10, 2001. Among this Post-9/11 cohort of student veterans, 41% reported a service-connected disability. The U.S. Department of Veterans Affairs (VA) reports that service-connected disabilities have risen 117% since 1990 and that growth is concentrated among those with a service-connected disability rating of 50% or higher.
Having a disability may affect veterans’ participation in the labor force, as well as participation in postsecondary education. A recent Brookings Institution report on labor force participation reported that prime-age veterans (ages 25-54) are less likely to be in the labor force than their nonveteran counterparts. This disparity is because more veterans experience disabilities, which result in lower participation rates overall.
According to Brookings, however, when participation in postsecondary education is factored in, both male and female veterans’ overall engagement (both workforce and/or school) is higher than among nonveterans: for ages 25-40 among males and even more so among females, from ages 25-50. Furthermore, comparing veterans and nonveterans who report a disability, veterans participate in the labor force at higher rates than nonveterans.
Veterans who qualify for GI Bill benefits may also be eligible for services provided through the Vocational Rehabilitation and Employment Program (VR&E). This program provides comprehensive services and assistance necessary to enable veterans with service-connected disabilities and an employment handicap to obtain stable and suitable employment. Qualified veterans may apply for either vocational rehabilitation and employment benefits or for education/career counseling.
Prevalence of Disability
According to Education Department data, 33% of first-time undergraduate veterans who began their studies in 2011-12 reported having a disability. Among student veterans with a disability, just over half report having either attention deficit disorder (26%) or mental, emotional, psychiatric conditions, or depression (29%), followed by hearing impairment (14%), brain injury (3%), orthopedic or mobility impairment (3%) and “other” (23%).
Postsecondary Enrollment
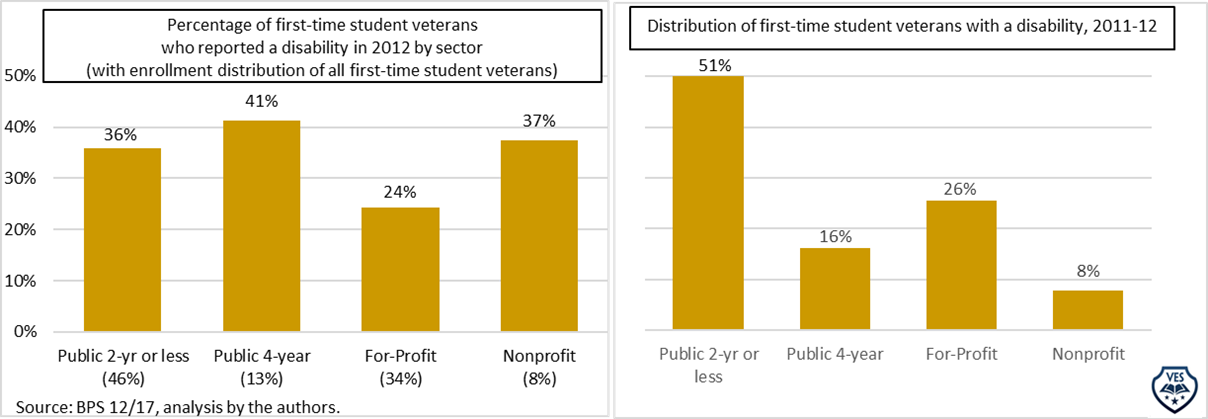
The percentage of first-time undergraduate veterans reporting a disability varies by sector, ranging from 24% of veterans enrolled at for-profit institutions to 41% of those at public 4-year colleges and universities (figure 1A).
Student veterans with a disability are more likely to enroll at public institutions than are first-time non-disabled student veterans (67% vs. 55%, respectively), possibly due to support services and accommodations available to such veterans at those institutions (figure 1B).
Figure 1A and 1B
Additional characteristics of first-time undergraduate student veterans with a disability include:
- During the first year of their postsecondary enrollment, veterans with (68%) and without a disability (70%) were equally likely to be enrolled in school full-time. However, non-disabled veterans were less likely to be enrolled exclusively part-time (18% vs. 27%) and more likely to be a mixture of the two (11% vs. 5%).
- Student veterans with a disability were more likely to be enrolled in associate degree programs than their non-disabled veteran counterparts. As of 2017, 48% of veterans with a disability were enrolled in associate degree programs and 33% in bachelor’s programs compared to 41% and 42%, respectively, among non-disabled veterans. The degree pursued can have an impact on earnings; associate degree graduates generally have lower lifetime earnings than bachelor’s degree graduates.
- Student veterans with a disability delayed their first postsecondary enrollment for an average of 8.9 years after high school graduation and discharge from the military, with 38% delaying 6 or fewer years, 41% for 7-to-10 years, and 21% delaying enrollment for more than 10 years. Average delayed enrollment for non-disabled veterans was slightly longer (9.8 years).
Figure 2A
Self-Reported Factors Affecting the Enrollment of Veterans with a Disability
- Sixty-two percent of veterans with a disability “strongly agreed” that they had the confidence in their ability to succeed academically; whereas 22% indicated that they “strongly” or “somewhat” disagreed. In contrast, a slightly smaller percentage of non-disabled veterans (58%) said they had the confidence to succeed academically and only 6% somewhat or strongly disagreed.
- About 10% of veterans with a disability reported missing school or work one or more days per week, compared to 7% of non-disabled veterans.
- Over half of veterans with a disability reported “excellent, very good, or good” physical and mental health (70% and 87%, respectively) and about 30% reported “fair” or “poor.” Among non-disabled veterans, a higher proportion (88%) reported excellent to good physical health and, similar to veterans with a disability, 87% said that their mental health was excellent-to-good.
Six-Year Degree Attainment and Persistence Among Veterans
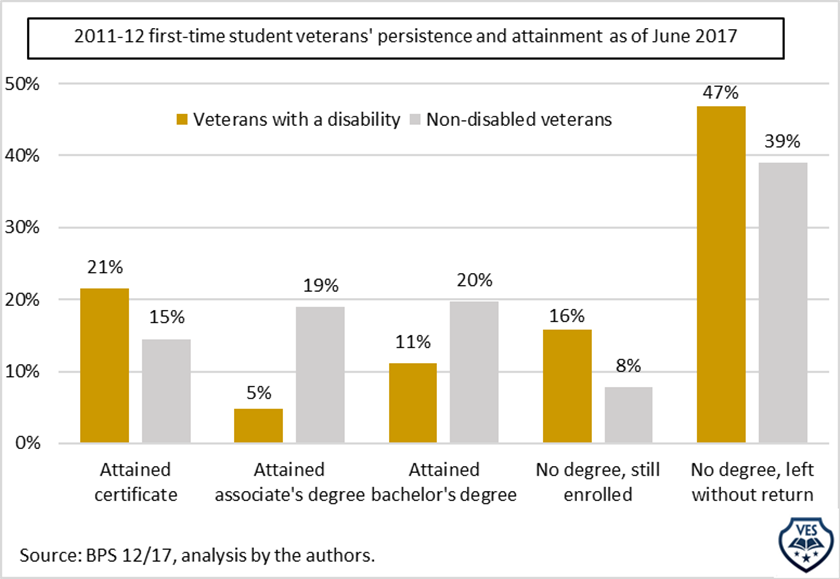
As of 2017, the postsecondary completion rate for veterans with a disability was lower than that of their non-disabled veteran counterparts for those pursuing associate and bachelor’s degrees. Among first-time student veterans with a disability who enrolled in 2011-12, 37% had completed at least one degree by 2017 and 63% were either still enrolled or had left (fig 2A).
Eleven percent of veterans with a disability had completed a bachelor’s degree (of which about 5% had also completed an associate’s during the 6-year period), with 16% still enrolled and pursuing a degree. By comparison, 53% of veterans not reporting a disability had completed (20% with a bachelor’s degree by 2017, 19% an associate degree and 15% a certificate) (figure 2A).
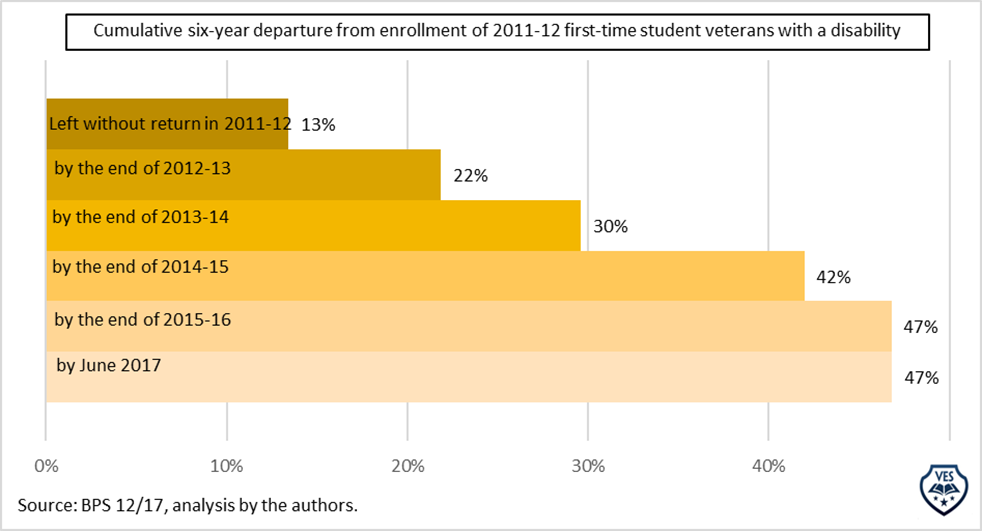
Regarding persistence, almost half of veterans with a disability who began their degree in 2011-12 left postsecondary education by 2017. Based on this analysis, the riskiest years are the first and fourth (figure 2B). Veterans with a disability were more likely to have left postsecondary education than other veterans (47% vs. 39%) and were twice as likely to still be enrolled (16% vs. 8%).
Outcomes for Veterans vs. Non-Veterans with a Disability
We also compared attainment for veterans and non-veterans with a disability. Non-veterans with a disability (12%) were more likely to have completed an associate’s degree by 2017 than their veteran counterparts (5%) with a disability. However, the reverse was true for certificates—22% of veterans with a disability had earned certificates by 2017, compared to 12% of non-veterans with a disability. Attainment of a bachelor’s degree by veterans and non-veterans with a disability were similar, 11% and 10% respectively.
Persistence among veterans with a disability was higher than among their non-veteran counterparts with a disability by 7 percentage points. Thus, 47% of veterans with a disability had left postsecondary education without a credential by 2017 compared to 54% of their non-veteran disabled counterparts.
Figure 2B