Click here to download a PDF of the report.
On June 8, 2020, the National Bureau of Economic Research announced that the U.S. economy had peaked in February 2020 and officially entered into a recession. Historical research consistently demonstrates that economic recessions are associated with postsecondary enrollment spikes and that enrollment declines as a recovery takes hold.
Nevertheless, consumer responses to prior recessions may not hold true in the current health pandemic. Over the course of 2 weeks in March 2020, the COVID-19 pandemic forced postsecondary institutions that provide classroom instruction on college campuses to quickly adopt distance learning modalities. There remains considerable uncertainty about (1) if, how, and when campuses will reopen in the fall of 2020, and (2) the response of students if campuses are forced by the pandemic to continue distance learning.[1] Will students opt to take a gap year, demand tuition reductions if classroom instruction is reduced or eliminated, enroll at institutions closer to home or that cost less, or embrace distance education and enroll in exclusively online programs? Also uncertain is whether, depending on the depth and length of the recession, older, unemployed adults will attempt to burnish their credentials by returning to school?
The objective of this primer is to: (1) synthesize the academic research on the relationship between postsecondary enrollment growth and recessions; (2) examine changes in overall and sector enrollment with a focus on trends from 2007 to 2012; and (3) highlight other factors that may affect enrollment, including recruiting and institutions’ readiness to offer distance education.
[1]In May, the California-State system announced it would offer primarily online classes for the upcoming fall 2020 academic semeste Cancel r. A recent report by the Community College Research Center at Columbia University’s Teachers College looked at the 2007 recession to better understand how the COVID-19 pandemic might affect community college enrollment.
Highlights
- Research conducted since at least the 1950s has found a countercyclical relationship between postsecondary enrollment and recessions.
- The experience of the past 12 years suggests the need for vigilance as unemployment mounts and some schools sense an opportunity to profit from the impact of the pandemic-induced recession on postsecondary enrollment.
- During the most recent recession, total postsecondary enrollment increased from 17.2 million students in 2006 to 20.4 million students in 2011, and subsequently decreased to 19.1 million students in 2015.
- Most of the enrollment increase in the last recession was among older adults who enrolled in community colleges and online for-profit schools.
- Outcomes from the increase in postsecondary enrollment during the last recession were disappointing. According to the National Student Clearinghouse “only 39 percent of students who enrolled in a two-year institution in 2008 had a degree six years later….”
- During the last recession, the distribution of overall and Post-9/11 GI Bill enrollment increased at for-profit schools largely at the expense of public institutions.
- Reliance on misleading advertising and recruiting by predatory institutions played a role in the enrollment growth of for-profit schools over the last decade?.
- Examining the impact of the last recession (which started in December 2007) on the enrollment of veterans and eligible family members is complicated because of the passage of the more generous Post-9/11 GI Bill 6 months later, in June 2008. In part, the new benefit explains the initial increase in GI Bill enrollment. By fiscal year 2010, the Post-9/11 GI Bill accounted for almost one half of beneficiaries using any of the GI Bill programs,[1] which surged 42 percent compared to enrollment during the prior fiscal year.
- As of 2018, about half of students at for-profit schools were in exclusively online programs compared to 20 percent and 12 percent of students at nonprofit and public institutions, respectively.
Postsecondary Enrollment Trends During the 2007 Recession
Research conducted since at least the 1950s has found a countercyclical relationship between postsecondary enrollment and recessions. An enrollment surge occurred during the last major recession, which began in December 2007, and matriculation began to decline about 4 years later, in 2011.
A 2018 U.S. Census Bureau report, which examined college enrollment before, during, and since the 2007 recession, noted that “During economic contractions, attending college becomes a more attractive option for some people as the worsening labor market reduces the amount of potential earnings foregone in order to obtain additional education.”[2] Key Census Bureau findings include:
- Total postsecondary enrollment increased from 17.2 million students in 2006 to 20.4 million students in 2011, and subsequently decreased to 19.1 million students in 2015.[3]
- The recession saw a 33 percent increase in enrollment in 2-year colleges from 2006 to 2011.
- Change in enrollment occurred overwhelmingly at the undergraduate level, and the 2011 to 2015 decrease in enrollment was concentrated in 2-year colleges. However, the number of students enrolled in two-year colleges by 2015 was still 10 percent above the level in 2006.[4]
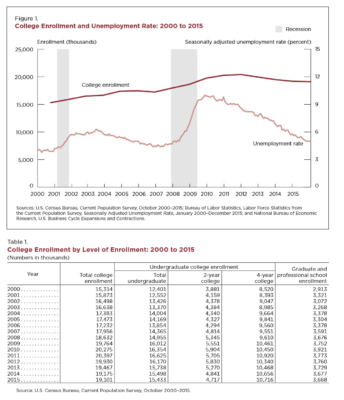
Source: Schmidt, Erik (2018), “Postsecondary Enrollment Before, During, and Since the Great Recession.” Washington, D.C.: P20580, U.S. Census Bureau, Current Population Reports, April.
Note: The Census Bureau data reflect enrollment as of the fall of each year.
The downturn in economic activity began in December 2007 and lasted until the economy began to grow again in June 2009. However, Douglas Shapiro, the executive research director of the National Student Clearinghouse, pointed out that there was an 18-month time lag between workers being laid off, the end of their unemployment benefits, and enrollment in school.[5]
“When the reality sets in that they’re not going to find another job, then they start thinking about school,” [Doug] Shapiro said. “And by the time they get through the whole process of finding a school and getting into a school, a year and a half to two years has gone by.”[6]
This lag between the start of a recession and enrollment in school could be increased in 2020 because the pandemic health crisis adds a new layer of uncertainty about both job and educational opportunities not evident during the last recession. According to Shapiro, most of the enrollment increase in the last recession came from older adults who enrolled in community colleges and online for-profit schools. Outcomes, however, were disappointing because “only 39 percent of students who enrolled in a two-year institution in 2008 had a degree six years later….”[7]
Research examining “The Financial Crisis and College Enrollment” by Bridget Terry Long also found that college attendance increased during the recession, especially in the states most affected by the recession. [8] However, “part-time enrollment grew while full-time enrollment declined. The tuition revenue collected per student also grew, while grants did not offset the increase in cost and student loans increased.”[9]
Although the 2009 American Recovery and Reinvestment Act provided incentives for college enrollment, other factors contributed to rising student debt levels.[10] The maximum Pell Grant award increased, but states cut funding for postsecondary institutions leading to a rise in tuition at public institutions. In a recent New York Times article, Kevin Carey, Education Policy Program Director at the New America Foundation, pointed out:
“Nationwide, the effect of the last recession on university finances [cuts in state funding] was partly offset by tuition increases financed by federally guaranteed student loans. But that just shifted the problem from one place to another. When Lehman Brothers collapsed in September 2008, Americans owed about $660 billion in outstanding student loan debt. That amount is over $1.6 trillion today.”
We also examined how the increase in the enrollment was distributed across institutional sectors. We found that for-profit schools’ share of students increased primarily at the expense of public institutions. As shown in Figure 2, for-profit schools’ share of enrollment increased steadily after the 2001-02 academic year, while public institutions’ share was declining. For-profit schools’ share of enrollment increased from 9 percent for the academic year immediately preceding the December 2007 recession (2006-07) to 13 percent by academic year 2010-11. During the same time period, public institutions’ share of enrollment declined from 74 percent to 70 percent, while nonprofits’ enrollment share decreased from 17 percent to 16 percent.[11]
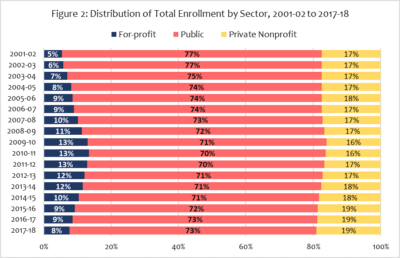
Source: U.S. Department of Education, National Center for Education Statistics, Integrated Postsecondary Education Data System (IPEDS), 12-month Enrollment component provisional data.
For comparison, Figure 3 shows the annual rate of change in enrollment within each sector. For instance, the for-profit sector’s peak at 13 percent of enrollment in 2009-10 resulted from a drastic 22 percent single-year increase in the number of students enrolled in that sector. The public and nonprofit sectors experienced only slight increases of 4 and 2 percent in the same year, respectively.
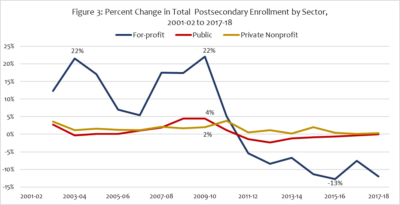
Source: U.S. Department of Education, National Center for Education Statistics, Integrated Postsecondary Education Data System (IPEDS), 12-month Enrollment component provisional data.
Note: These data are the unduplicated 12-month enrollment at institutions from July 1 of one year through June 30 of the next.
GI Bill Beneficiary Enrollment Trends During the Last Recession
Examining the impact of the last recession (beginning December 2007) on the enrollment of veterans and eligible family members is complicated because of the passage of the more generous Post-9/11 GI Bill 6 months later, in June 2008. Research by Liang Zhang suggests that “part of the initial enrollment burst was due to the retrospective nature of the GI Bill,” that is, “the retrospective eligibility might have encouraged a large number of veterans who did not attend college under MGIB [the Montgomery GI Bill] to change their college participation decisions.”[12] Zhang acknowledges, however, that “it is possible that educational benefits may become more attractive to veterans during economic downturns than in normal times.”
While the older Montgomery GI Bill pays beneficiaries a monthly stipend to cover a portion of college-associated costs, the more generous Post-9/11 benefit covers in-state tuition and fees at public institutions and tuition and fees up to an inflation-adjusted cap (about $24,500 in academic year 2019-2020) at nonprofit and for-profit schools, in addition to living and book stipends. The living stipend is based on the zip code of the school where beneficiaries take the majority of their classes and, during calendar year 2020, ranges from a low of $1,236 each month in Boise, Idaho, to a high of $3,234 in New York.
Our analysis of the U.S. Department of Veterans Affairs (VA) annual benefit reports found that GI Bill enrollment surged in fiscal year 2010, increasing by 42 percent, and continued to grow until about fiscal years 2013 or 2014 (see Figure 4.) The enrollment surge occurred in fiscal year 2010 rather than 2009 because the Post-9/11 benefit only became available to beneficiaries in the last 2 months of fiscal year 2009. It is important to note that the Montgomery GI Bill, the Post-9/11 benefit, and several other GI Bill benefit programs all continue to be available to eligible beneficiaries; about 80 percent of beneficiaries have been using the Post-9/11 GI Bill since fiscal year 2014 (see yellow shaded area in Figure 4).
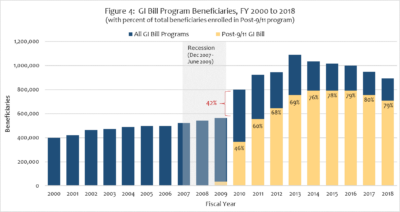
Source: U.S. Department of Veterans Affairs, Veterans Benefits Administration, Annual Benefits Reports, 2000 to 2018.
VA’s annual benefits report does not break down enrollment under all the GI Bills by institutional sector. The only available data set that does so focuses on the enrollment of beneficiaries using the Post-9/11 benefit only. Our analysis found that the share of Post-9/11 beneficiaries at for-profit schools surged from 9 percent in fiscal year 2009 to 30 percent by fiscal year 2012, while the share of such beneficiaries at public institutions dropped from 76 percent to 52 percent over the same timeframe (see Figure 5).
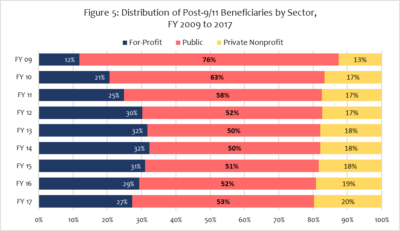
Source: Analysis of VA historical data on the Post-9/11 GI Bill released in 2018 as part of VA’s Transparency Project, http://www.va.gov/transparency/Post-9-11-GI-Bill-Data.xlsx. Appendix A, Table 3 provides the data for this table.
We also examined enrollment trends in degree and non-degree program types for new GI Bill beneficiaries; that is, individuals who were attending a postsecondary institution for the first time. As shown in Figure 6, the proportion of beneficiaries enrolled in non-college degree programs had surged from 4 percent in fiscal year 2008 to 35 percent by fiscal year 2010.[13] The majority of non-degree programs are offered by for-profit schools; and Department of Education data show that many certificate programs, particularly at for-profits, result in low earnings for the typical graduate receiving Pell Grants or student loans.[14]
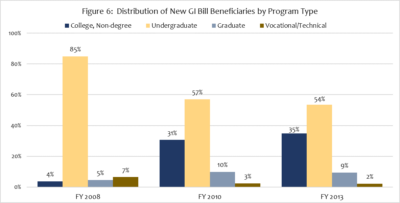
Source: U.S. Department of Veterans Affairs, Veterans Benefits Administration, Annual Benefits Reports, 2008, 2010, 2013. The data for Figure 5 is included in Appendix A, Table 4.
Note: Comparable data were not available for fiscal years 2009 and 2012.
Misleading Advertising and Recruiting Contributed to For-Profit Enrollment Growth during the Last Recession
Enrollment growth at for-profit schools from 2008 through 2011 was fueled, in part, by aggressive recruiting tactics and reliance on deceptive and misleading advertising to “close the deal” with prospective students. Those recruiting tactics, including the use of “pain-based” emotional manipulation techniques in order to convince individuals to enroll, were well-documented in a 2012 report by the U.S. Senate Committee on Health, Education, Labor and Pensions.[15] Aggressive marketing to veterans is incentivized by for-profit schools’ need to offset their dependence on Title IV federal student aid, which is capped at 90 percent of total revenue. Even though revenue for educational benefits from the Departments of Veterans Affairs (VA) and Defense (DOD) are also federal revenue, for-profit colleges manipulate a loophole to count these funds as part of the 10 percent intended to be covered by non-federal funds. For-profit institutions have an incentive to target veterans because of this loophole: for every $1 of military-connected student benefits a for-profit school receives from VA or DOD, it can collect $9 more from Title IV funding. As Holly Petraeus, the former Director of Servicemember Affairs at the U.S. Consumer Financial Protection Bureau, wrote, “This gives for-profit colleges an incentive to see servicemembers as nothing more than dollar signs in uniform.”
Since 2012, numerous for-profit schools have settled with a law enforcement entity or had a final judgment rendered that documented the widespread use of misleading claims about educational quality, transferability of credits, job placement rates, post-graduation salaries, accreditation, and costs (see text box). Moreover, many other predatory schools remain under investigation by federal and state authorities, which could lead to additional settlements and judgments.
Law Enforcement Settlements with and Final Judgments Against Predatory Schools Since July 2012
| Alta, Ashworth, ATI, Bridgepoint, Canyon College, Career Education Corporation, Daymar College, DeVry, Education Affiliates, Education Management Corporation (EDMC), Globe University and Minnesota School of Business, Herzing University, Hosanna College of Health, Kaplan, Keiser University, La’James International College, Lincoln Technical Institute, National College, New England College of Business and Finance, Penn Foster, Premier Education Group, Sullivan and Cogliano Training Centers, and University of Phoenix. |
Source: Veterans Education Success, Law Enforcement Actions Against Predatory Colleges.
Note: With the exception of Keiser University, which converted from for-profit to nonprofit status in 2002, all of these institutions are for-profit schools.
The ramp up in recruiting activities by for-profit and nonprofit as well as public institutions in response to COVID-19 has been well documented.
- A report by kivvit, a company that designs and manages advertising campaigns for clients, analyzed the Facebook advertising of 416 U.S. higher education institutions between March 12 and May 19, 2020. The goal was to understand how postsecondary institutions were adapting their marketing in the age of COVID-19. Compared to the same period 1 year ago, kivvit found that higher education advertising increased by 7 percent during the pandemic. According to the report, “private and for-profit online entities were among the largest education advertisers and drove the increase in spending, seeking to capitalize on the uncertainty that currently surrounds on-campus learning.” The top 10 institutions by ad spending were Western Governors University, Purdue, University of Pittsburgh System, Strayer, University of Phoenix, Massachusetts Institute of Technology, University of Florida, The Regents of the University of California, Walden University, and Chamberlin College of Nursing.[1] Four of the top 10 institutions were for-profit schools and Purdue, a public college, had purchased for-profit Kaplan College in 2018 and rebranded it “Purdue Global.” Kaplan has a 30-year contract to provide services to Purdue, including
- The Chief Executive of for-profit American Pubic Education Inc., told New York Times reporters that “The pandemic has created an unexpected opportunity.” She informed investors that the company has started spending part of its marketing budget originally earmarked for later this year. On March 26, 2020, the owners of Ashford University announced that it planned to hire more than 200 “enrollment advisors” in the next four months. The announcement stated that “these services meet an especially critical need during this time of social distancing and self-quarantine.”
A May 2020, Brookings Institution report using 2017 data on college advertising found that “Degree-granting for-profit institutions account for about 40% of all higher education advertising spending, while serving just 6% of students. Among the institutions that advertise, for-profit institutions spend almost $400 on advertising per student, compared to just $48 per student among nonprofits and $14 per student among public institutions.”
Ashford is already under intense scrutiny over concerns about its use of deceptive and misleading advertising and recruiting. In November 2017, the California Attorney General filed a lawsuit alleging that Ashford’s recruiters “preyed” on veterans, making “a wide variety of false and misleading statements to prospective students to meet their enrollment growth targets, including how much financial aid students would get, how many prior academic credits would transfer into the school, and the school’s ability to prepare students for careers in fields like social work, nursing, medical billing, and teaching.” Moreover, Ashford settled lawsuits for misleading advertising and recruiting in 2014 and 2016 (see our fact sheet identifying schools with multiple settlements). In August 2020, the University of Arizona announced that it was purchasing Ashford University and rebranding it as University of Arizona Global Campus, an online endeavor. According to press coverage of the deal, the former owners of Ashford University (Bridgepoint Education, renamed Zovio) will be “deeply involved” in running the University of Arizona Global, as was the case with Purdue’s purchase of Kaplan. In a twist, University of Arizona Global will operate as a nonprofit entity even though the University of Arizona is a public sector institution.
The experience of the past 12 years suggests the need for vigilance as unemployment mounts and some schools sense an opportunity to profit from the impact of the pandemic-induced recession on postsecondary enrollment.
[1]Chamberlin College of Nursing is owned by for-profit DeVry Education Group (now Adtalem).
Postsecondary Institutions’ Readiness for Distance Education in 2020
A December 2019 report by The Institute of College Access & Success (TICAS) noted that for-profit schools have moved away from campus-based classes over the past 5 years, with a larger share of students attending exclusively online programs, particularly at large for-profit chains. As of 2018, about half of students at for-profit schools were in exclusively online programs, compared to 20 percent and 12 percent of students at nonprofit and public institutions, respectively. Moreover, TICAS reported that “80 percent of students attending an exclusively online program at a for-profit college do so from out of state,” leaving them vulnerable to gaps in oversight and consumer protections from their states.
Over the past 10 years, some public and nonprofit institutions have invested in distance learning and have a large online footprint. However, other public and nonprofit institutions are at a competitive disadvantage because of the boost given to distance learning by the pandemic. Another challenge for public institutions is the prospect of state budget cuts. Kevin Carey, the Director of the education policy program at the New America Foundation, foresees another round of state funding cuts, which would result in higher tuition and yet fewer services to increase student success.
Methodology
We conducted a literature review on the countercyclical relationship between recessions and college enrollment and summarized the research findings on the effect of the last recession (beginning December 2007) on postsecondary enrollment. To determine the overall change in enrollment by sector, we analyzed data from the Education Department’s Integrated Postsecondary Enrollment System. We analyzed two datasets to report on enrollment changes for GI Bill beneficiaries: (1) VA’s Annual Benefits Report for year-to-year changes in GI Bill enrollment; and (2) VA historical data on the Post-9/11 GI Bill released in 2018 as part of the Department’s Transparency Project. Even though seven GI Bill programs have paid benefits for eligible beneficiaries since fiscal year 2007, enrollment data by sector is available only for the Post-9/11 GI Bill.
Appendix A
Table 2: Number of students enrolled in postsecondary institutions annually by control of institution
| Academic Year | Total | Public | Nonprofit | For-profit |
| 2001-02 | 23,010,948 | 17,755,304 | 4,007,071 | 1,248,573 |
| 2002-03 | 23,793,871 | 18,240,211 | 4,151,452 | 1,402,208 |
| 2003-04 | 24,094,265 | 18,189,594 | 4,200,939 | 1,703,732 |
| 2004-05 | 24,475,143 | 18,211,581 | 4,269,075 | 1,994,487 |
| 2005-06 | 24,689,847 | 18,232,818 | 4,323,594 | 2,133,435 |
| 2006-07 | 25,043,867 | 18,423,167 | 4,371,712 | 2,248,988 |
| 2007-08 | 25,886,779 | 18,778,268 | 4,464,844 | 2,643,667 |
| 2008-09 | 27,253,481 | 19,611,713 | 4,539,500 | 3,102,268 |
| 2009-10 | 28,907,440 | 20,489,554 | 4,631,050 | 3,786,836 |
| 2010-11 | 29,507,367 | 20,724,550 | 4,805,278 | 3,977,539 |
| 2011-12 | 29,036,155 | 20,445,489 | 4,828,368 | 3,762,298 |
| 2012-13 | 28,300,104 | 19,968,052 | 4,885,207 | 3,446,845 |
| 2013-14 | 27,835,916 | 19,723,396 | 4,895,324 | 3,217,196 |
| 2014-15 | 27,410,085 | 19,564,544 | 4,993,346 | 2,852,195 |
| 2015-16 | 26,953,976 | 19,447,051 | 5,016,694 | 2,490,231 |
| 2016-17 | 26,706,865 | 19,382,038 | 5,022,463 | 2,302,364 |
| 2017-18 | 26,436,441 | 19,372,434 | 5,038,242 | 2,025,765 |
Source: U.S. Department of Education, National Center for Education Statistics, Integrated Postsecondary Education Data System (IPEDS), 12-month Enrollment component 2018-19 provisional data.
Notes: This table presents data items collected from Title IV institutions in the United States. Prior to 2009- 10, the data include only Title IV primarily postsecondary institutions. This is the unduplicated 12-month enrollment at institutions from July 1 of one year through June 30 of the next. Prior to 2010-11, institutions could choose to report on the 12-month period between July 1 and June 30 or September 1 and August 31.
Table 3: Post-9/11 GI Bill Enrollment from Fiscal Years 2009 through 2017
| FY 09 | FY 10 | FY 11 | FY 12 | FY 13 | FY 14 | FY 15 | FY 16 | FY 17 | |
| Public | 11,577 | 259,124 | 346,182 | 354,979 | 394,509 | 395,943 | 396,365 | 404,613 | 385,253 |
| For-profit | 1,813 | 85,038 | 149,113 | 203,996 | 247,264 | 255,910 | 243,355 | 229,281 | 198,103 |
| Non-profit | 1,914 | 68,838 | 104,652 | 117,466 | 139,858 | 142,684 | 144,121 | 150,282 | 143,662 |
| Total Beneficiaries | 15,304 | 413,000 | 599,947 | 676,441 | 781,631 | 794,537 | 783,841 | 784,176 | 727,018 |
Source: Analysis of VA historical data on the Post-9/11 GI Bill released in 2018 as part of VA’s Transparency Project, http://www.va.gov/transparency/Post-9-11-GI-Bill-Data.xlsx
Table 4: Enrollment of New GI Bill Beneficiaries by Degree and Non-Degree Program Type, Fiscal Years
2008, 2010, and 2013
| Fiscal year | College,
non-degree |
Undergraduate | Graduate | Vocational/technical | Total new beneficiaries |
| Number of new beneficiaries | |||||
| FY 2008 | 4,556 | 101,031 | 5,630 | 7,784 | 119,001 |
| FY 2010 | 82,454 | 153,726 | 26,652 | 6,606 | 269,438 |
| FY 2013 | 92,483 | 142,087 | 24,897 | 5,769 | 265,236 |
Source: VA Annual Benefits reports, fiscal years 2008, 2010, and 2013.
[1] There are several GI Bill programs at the U.S. Department of Veterans Affairs. The Post-9/11 GI Bill represents more than 80% of the total GI Bill programs payments from fiscal years 2009-2018. Veterans Education Success, GI Bill Enrollment and Payments, Fiscal Years 2009-2018 (Oct. 2019), https://vetsedsuccess.org/gi-bill-payments-and-enrollment-fiscal-years-2009-to-2018/.
[2]Schmidt, Erik (2018), Postsecondary Enrollment Before, During, and Since the Great Recession. Washington, D.C.: P20580, U.S. Census Bureau, Current Population Reports, April. See Appendix A, Table 1 for Figure 1 data.
[3]Prior to 2006, college enrollment had been rising steadily.
[4]The decline in college enrollment is attributable, in part, to fewer high school graduates.
[5]He was interviewed for an April 2020 Hechinger Report article by Jill Barshay: How the Last Recession Affected Higher Education. Will History Repeat?
[6] Id.
[7] Id.
[8]Long’s research is included in a collection of papers presented at a September 2012 conference. See Brown, Jeffrey R. and Caroline M. Hoxby, editors (2014). How the Financial Crisis and the Great Recession Affected Higher Education. Chicago, Illinois: University of Chicago Press, December.
[9] Id.
[10]A recent analysis of federal student loan debt through March 31, 2020, by The Century Foundation found “a 7 percent increase in federal student loan disbursements—that is, in the dollar value of new loans issued to students—at for-profit colleges…the first year-over-year increase since 2010. At nonprofit and public schools, in contrast, borrowing continued a trend of modest declines, dropping 2 percent and 3 percent, respectively.”
[11]In the case of California, budget cuts resulted in community colleges’ cutting classes and staff, and even increasing class sizes. The cuts resulted waitlists, with community colleges unable to serve all the students who wanted to enroll.
[12]Liang Zhang (2018). Veterans Going to College: Evaluating the Impact of the Post-9/11 GI Bill on College
Enrollment. Newbury Park, California: Educational Evaluation and Policy Analysis, March. See report here.
[13]As shown in the Table 4 in Appendix A, the number of first-time GI Bill beneficiaries enrolled in undergraduate programs increased from fiscal years 2008 to 2010 but represented a lower percentage of overall enrollment by such beneficiaries.
[14]See Table 1 at this link for a comparison of sector differences in non-college degree programs.
[15]See For-Profit Higher Education: The Failure to Safeguard the Federal Investment and Ensure Student Success. Washington, D.C.: U.S. Senate Committee on Health, Education, Labor, and Pensions, July 30, 2012. The Senate report provided this example of how ITT Tech recruiters were instructed to use pain to manipulate the emotions of prospective students: “To address students that sign an enrollment agreement but indicate they may not want to start school, recruiters are instructed to “poke the pain a bit” and “remind them what things will be like if they don’t continue forward and earn their degrees.”