As America grapples with systemic racial injustice, it is more important than ever to examine the outcomes of veterans of color who are using the GI Bill to earn a postsecondary credential. In a 2011 commencement address, the Secretary of Education said that postsecondary education could be a “great equalizer” because, on average, Americans who earn a bachelor’s degree will earn roughly $1 million more over their lifetime than those with only a high school diploma. The payoff is particularly relevant for persons of color (nonwhite individuals), whose representation has grown since the end of the draft and the creation of the all-volunteer Armed Forces. According to Defense Department data analyzed by the Pew Research Center, persons of color now constitute a significant and growing proportion of the enlisted ranks. This report uses data from three U.S. Department of Education (ED) surveys to analyze the postsecondary outcomes of undergraduate veterans of color and to compare their outcomes to those of their white veteran and nonveteran counterparts.
Highlights
Postsecondary outcomes were mixed for undergraduate veterans of color, who constituted 41 percent of undergraduate veterans in academic year 2015-16.
- Undergraduate veterans of color were more likely to earn bachelor’s degrees than their white peers and slightly more likely to earn associate’s degrees. They also outperformed nonveterans of color, earning almost twice as many associate’s and bachelor’s degrees.
- Compared to white undergraduate veterans, veterans of color were more likely to withdraw without a credential, which may be related to the fact that greater proportions of veterans of color were associated with five or more of seven risk factors linked to noncompletion, such as having dependents or being single parents.
- Among bachelor’s degree graduates, the cumulative student loan debt and the percentage who borrowed was similar for white veterans and veterans of color. Irrespective of race, both veterans and nonveterans who earned bachelor’s degrees at for-profit schools had more student loan debt than those who graduated with bachelor’s degrees from public- and nonprofit-sector institutions.
- Although about 40 percent of veteran and nonveteran undergraduates were enrolled in community colleges, those of color were more likely than their white peers to enroll in for-profit institutions.
- The use of GI Bill benefits by undergraduate veterans of color was lower than that of their white peers across all institutional sectors and for each year of enrollment.
- Compared to nonveterans, undergraduate veterans were much more likely to be male and 30 or older. However, undergraduate veterans of color were more likely than their white peers to be female.
- Currently, the only data sources for analyzing outcomes of different cohorts of veterans are the ED surveys, but this data has gaps. It does not include, for example, institution-specific veteran outcomes or persistence for GI Bill beneficiaries who are not first-time, full-time students.
Methodology
We used three ED surveys to examine postsecondary outcomes and other key metrics for both veterans and nonveterans who are persons of color.
National Postsecondary Student Aid Study (NPSAS). This quadrennial, comprehensive, nationally representative survey is conducted by ED’s National Center for Education Statistics (NCES). The goal of NPSAS is to determine how students finance their college education. The survey sample contains about 89,000 undergraduate students at more than 1,800 public, nonprofit, and for-profit postsecondary institutions. In addition to student interviews, NPSAS relies on institutional and government administrative data. For our analysis, we used NPSAS:16, the most recent iteration of the survey.
Baccalaureate and Beyond (B&B). This longitudinal survey (B&B:16/17) focuses on the NPSAS subset of students who completed their baccalaureate degree in 2015-16 and provides insights on their post-collegiate transition. The students in the sample will be resurveyed approximately 4 years after their graduation. B&B allows researchers to address questions regarding bachelor’s degree recipients’ undergraduate experiences, including their participation in various financial aid programs, undergraduate debt, and repayment of that debt; entrance into and progress through post-baccalaureate education; and employment.
Beginning Postsecondary Students (BPS). BPS, which focuses on a subset of the NPSAS sample, is also a longitudinal survey that follows a cohort of students who enrolled for the first time (beginning) in postsecondary education in 2011-12. These first-time postsecondary students in BPS:12/17 participated in three interviews: in 2012, at the end of their first year; in 2014, about 3 years after they started postsecondary education; and in 2017, approximately 6 years after they first enrolled.
The majority of analyses in this report are based on NPSAS:16. NPSAS is more representative of students than BPS because it includes individuals both with and without prior college experience. It does not, however, follow a cohort of students over time. To analyze veteran and nonveteran persistence and attainment, we used BPS:12/17 even though it only includes first-time students. Because students interviewed for BPS began their postsecondary education in 2011-12, the impact of for-profit school closures is likely reflected in noncompletion, transfer rates, and time-to-degree for students who were ever enrolled in that sector. We also used B&B:16/17 to illustrate the time-to-degree for veterans and nonveterans earning bachelor’s degrees because such data are not available in NPSAS.
Race and Ethnicity. NCES surveys provide multiple variables for reporting on race and ethnicity, which allows researchers to either combine or analyze them separately. For this analysis, we report Hispanic data separately; all other races shown are non-Hispanic, e.g., white non-Hispanic, Black non-Hispanic.[1]
Our analysis compared outcomes for veteran undergraduates of color to those of white veterans as well as to the nonveteran counterparts for both groups. We focused on undergraduates because the vast majority of veteran students are undergraduates, and graduate student veterans (1) are more likely to have been officers who already had a bachelor’s degree, (2) are older, (3) may be seeking a postgraduate degree to enhance their earnings potential, (4) are more likely to have clear career goals and to be working full time, and (5) may have older dependents. Veterans are considered independent students for purposes of federal student aid because they are financially independent of their parents based on their age, marital status, or dependents, and therefore we compared them to nonveteran independent undergraduates.[2] In addition, we excluded foreign students from our analyses.
Demographics
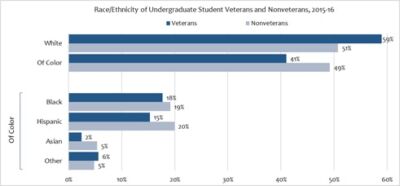
In academic year 2015-16, undergraduate veterans of color accounted for about 41 percent of undergraduate student veterans. This percentage of veterans of color is consistent with the Defense Department’s 2017 demographics report, which showed that 43 percent of active-duty military personnel were persons of color (data that included both the enlisted ranks and officers).[3] In contrast, nonveterans of color constituted nearly 50 percent of nonveteran undergraduates, a higher proportion than their representation in the general population.[4]
Four-fifths of undergraduate veterans of color identified as Black (18 %) or Hispanic (15 %), with the remainder either Asian (2 %) or other (6 %).[5] The breakdown of nonveteran independent undergraduates of color by race/ethnicity was similar to that of veterans. (Figure 1.)
Figure 1
Source: NPSAS: 16.
Note: Because veterans are considered independent students for purposes of federal student aid, we compared them to nonveteran independent students.
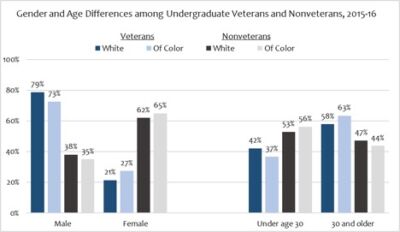
We found notable differences between undergraduate veterans and nonveterans in two other areas—gender and age.[6] Undergraduate veterans were much more likely to be male and 30 or older, while their nonveteran counterparts were more likely to be female and under age 30. Among female undergraduate veterans, however, the proportion who were persons of color (27 %) was greater than their white peers (21 %); male undergraduate veterans were more likely to be white than persons of color by a similar 6-percentage-point difference. With respect to age, veterans of color were somewhat more likely to be 30 or older (63 %) than their white peers (58 %). (Figure 2.)
Figure 2
 Source: NPSAS: 16.
Use of GI Bill Benefits
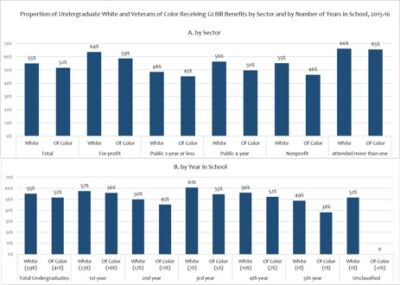
Not all veterans pursuing a postsecondary credential used GI Bill benefits.[7] In the 2015-16 academic year, roughly similar proportions of white veterans (55 %) and veterans of color (52 %) were using GI Bill benefits.[8] (Figure 3.)
Benefits Use by Institutional Sector. The use of GI Bill benefits by undergraduate veterans of color was lower than those of white veterans across all sectors, ranging from a 3-percentage-point difference at community colleges to a 9-percentage-point difference at nonprofit institutions. Compared to other postsecondary options, the use of benefits for both white (48 %) and veterans of color (45 %) was the lowest at 2-year public institutions, suggesting that the low cost of a community college may have influenced the decision to forgo the use of GI Bill benefits to pay for college. Conversely, the use of benefits by both white (64 %) and undergraduate veterans of color (59 %) was the highest at for-profit schools. The greater use of benefits at for-profit schools may be related to two factors: (1) for-profits offer primarily certificates, which may be a terminal credential for veterans having no plans to seek a higher-level degree (see discussion of attainment, below); and (2) for-profit schools’ certificate programs are more expensive than those offered by 2-year public institutions. (Figure 3A.)
Benefits Use by Year of Enrollment. The use of GI Bill benefits was higher in veteran students’ 1st year compared to the 5th year of school, but the disparity (11 percentage-points) between white undergraduate veterans (49 %) and veterans of color (38 %) was the largest 5 years after enrolling.[9] GI Bill benefits use by both white and veterans of color undergraduates was the smallest in the 5th year after enrolling compared to years 1 through 4, suggesting that some veterans may have exhausted their 36 months of benefits after 4 years of school.[10] The increase in benefits use in the 3rd and 4th years of school compared to the 2nd year may reflect the large proportion of veterans who start at a community college and then transfer to another institution to earn a bachelor’s degree. (Figure 3B.)
Figure 3
Source: NPSAS: 16.
Note: Because veterans are considered independent students for purposes of federal student aid, we compared them to nonveteran independent students.
Postsecondary Undergraduate Enrollment by Sector
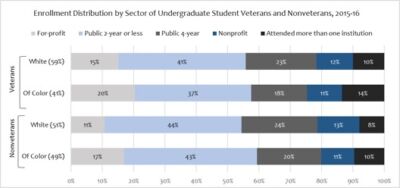
Percentage Distribution. Proportionally more persons of color than whites—both veterans and nonveterans—were enrolled in for-profit schools. Twenty percent of veterans of color and 17 percent of nonveterans of color attended for-profit schools in 2015-16 compared to 15 percent and 11 percent, respectively, of their white counterparts.
Compared to their white peers, undergraduate veterans of color were also less likely to attend a community college (41 % vs. 37 %), a public 4-year institution (23 % vs. 18 %), or a nonprofit (12 % vs. 11 %). However, greater proportions of nonveterans of color attended 2-year public schools (43 % vs. 37 %) and 4-year public schools (20 % vs. 18 %) than veterans of color. Finally, both veterans and nonveterans of color were more likely to attend more than one institution than were white veterans and nonveterans. (Figure 4.)
Figure 4
Source: NPSAS: 16.
Note: Each veteran/nonveteran cohort totals 100 percent. Although this figure does not show the actual size of each cohort, 17 percent of undergraduate veterans were enrolled in for-profit schools in 2015-16 compared to 14 percent of nonveterans. Because veterans are considered independent students for purposes of federal student aid, we compared them to nonveteran independent students.
Persistence and Attainment
Although the persistence of undergraduate veterans of color was weaker than that of their white peers, veterans of color were more likely to earn bachelor’s degrees than their white peers by 2017 and slightly more likely to earn associate’s degrees.[11] (Figure 5.)
Persistence. A higher proportion of undergraduate veterans of color (46 %) had left without a credential by 2017, compared to 39 percent of their white peers. This disparity, which did not exist between white nonveterans (49 %) and nonveterans of color (51 %), is worthy of policy makers’ attention. Similarly, a smaller proportion of undergraduate veterans of color were still enrolled as of 2017 compared to their white peers, 4 percent vs. 14 percent, respectively. In contrast, comparable proportions of white nonveterans and those of color were still attending school.
Attainment. Veterans of all races outperformed their nonveteran peers in degree attainment, and veterans of color outperformed their nonveteran peers at a substantially higher rate. Figure 5 shows that greater proportions of both white veterans and veterans of color (16 % and 19 %, respectively) had earned bachelor’s degrees by 2017 compared to their nonveteran counterparts (10 % and 7 %, respectively).[12] On this measure, veterans of color outperformed their nonveteran counterparts by 12 percentage points (19 % to 7 %, respectively), while just a 6-percentage-point difference separated white veterans from their nonveteran peers. Overall, 34 percent of undergraduate veterans of color earned associate’s and bachelor’s degrees compared to 18 percent of their nonveteran counterparts.
Among students of color, outcomes for certificate programs and associate’s degrees were mixed. For example, a higher proportion of veterans of color graduated with an associate’s degree compared to their nonveteran counterparts (15 % and 11 %, respectively). However, the reverse was true for certificate programs, where 17 percent of veterans of color earned certificates compared to 19 percent of nonveterans of color. The type of degree or certificate earned can have a significant impact on return on investment as measured by earnings (see text box).
Return on Investment Depends on Type of Credential Earned
| The degree being pursued can have an impact on earnings. For example, bachelor’s degree graduates generally have higher lifetime earnings than associate’s degree graduates. A 2014 report by the Georgetown Center for Education and the workforce found that the median lifetime earnings of bachelor’s degree graduates was $541,000 more than for those who earned an associate’s degree.a
An earlier report by the Center found considerable variation in median annual earnings for certificate graduates based on occupation, gender, geographic location, and whether graduates were employed in their field of study. The report noted that healthcare certificates, one of the most popular certificate fields of study, have relatively poor earnings returns, lowering the earnings returns for certificates in general.b However, the report also noted that median earnings for some certificates, such as computer and information services, may have higher annual earnings than some associate’s or bachelor’s degree graduates. _____________________ aAnthony P. Carnevale, Steven J. Rose, and Banh Cheah, The College Payoff: Education, Occupation, Lifetime Earnings (Washington, D.C.: Georgetown University Center on Education and the Workforce, November 2014), p. 3. bAnthony P. Carnevale, Steven J. Rose, and Andrew R. Hanson, Certificates: Gateway to Gainful Employment and College Degrees (Washington, D.C.: Georgetown University Center on Education and the Workforce, April 2012), pp. 20-21.
|
Figure 5
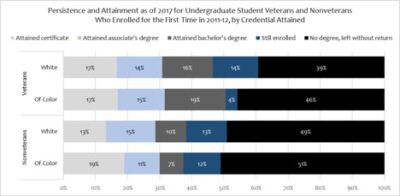
Source: BPS: 12/17.
Note: Because students may have enrolled at multiple institutions since 2011-12, the persistence and attainment data reported here are cumulative; that is, the data reflect all institutions attended during the time frame. We compared veterans to nonveteran independent students because both are considered independent students for purposes of federal student aid.
Sector. Looking at attainment data by institutional sector suggests that the greater completion of bachelor’s degrees by veterans of color compared to their white peers is driven by the matriculation of veterans of color at public institutions, where 26 percent earned such a degree compared to 9 percent of white veterans. [13] Although 55 percent of white veterans earned bachelor’s degrees at nonprofit institutions (Figure 6), the number of veterans attending nonprofit institutions is quite small; irrespective of sector, white veterans’ overall attainment of bachelor’s degrees is only 16 percent (Figure 5).
Similarly, the lower proportion of veterans who withdrew from for-profit schools without a degree compared to public and nonprofit institutions is likely related to the fact that the predominant degree earned at for-profit schools is a short-term certificate (i.e., 9-month), which students are more likely to complete than longer associate’s or bachelor’s degree programs. For example, our 2018 report found that 63 percent of graduates from 2-year for-profit schools in 2015-16 earned certificates compared to only 28 percent of public 2-year graduates.[14] Students are more likely to earn associate’s degrees at 2-year public institutions and bachelor’s degrees at 4-year public and nonprofit institutions than at for-profit schools.[15]
Figure 6
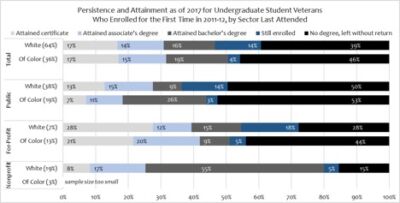
Source: BPS: 12/17.
Note: Because students may have enrolled at multiple institutions since 2011-12, the persistence and attainment reported here are cumulative; that is, it reflects all institutions attended during the time frame.
The closure of some for-profit schools from 2011 through 2017 likely contributed to the proportion of undergraduate student veterans and nonveterans who (1) left without a degree, (2) attended more than one institution, and (3) took longer than 2 or 4 years to earn degrees.[16] Overall, nonveteran enrollment in for-profit schools was substantially higher than among veterans in 2008, 2012, and 2016. Although veteran enrollment at for-profit schools increased between 2008 and 2012 (up 73%) and declined by 22 percent 4 years later, veteran enrollment in 2016 was still higher than in 2008. Nonveteran enrollment at for-profit schools also increased from 2008 to 2012 (46 %) and declined from 2012 to 2016 but, by 2016, nonveteran enrollment at for-profit schools was below 2008 levels. (Figure 7.)
Figure 7
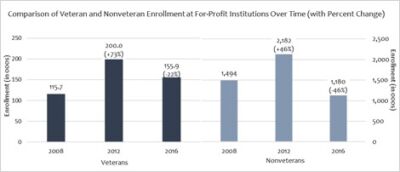
Source: NPSAS, Trendstats (2008, 2012, 2016).
Note: The axis for nonveteran enrollment is ten times that of veterans.
Time-to-Degree. More than 70 percent of veterans who completed a bachelor’s degree program in 2015-16 took more than 6 years to graduate, but the proportion of veterans of color doing so (79 %) was greater than that of their white peers (70 %). See Figure 8
Figure 8
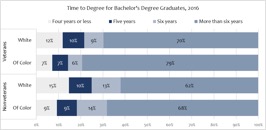 Greater proportions of veterans of color took more than 6 years to complete their bachelor’s degrees (79 %) compared to their white peers (70 %). At the same time, smaller proportions of veterans of color earned such degrees in from 4 years or less to 6 years compared to white veterans. For nonveterans, both white nonveterans and those of color earned bachelor’s degrees more quickly than their veteran counterparts. Greater proportions of veterans of color took more than 6 years to complete their bachelor’s degrees (79 %) compared to their white peers (70 %). At the same time, smaller proportions of veterans of color earned such degrees in from 4 years or less to 6 years compared to white veterans. For nonveterans, both white nonveterans and those of color earned bachelor’s degrees more quickly than their veteran counterparts.
Source: B&B: 16/17. Note: NPSAS does not collect data on time-to-degree, but such data is available in longitudinal surveys such as B&B. Risk Factors |
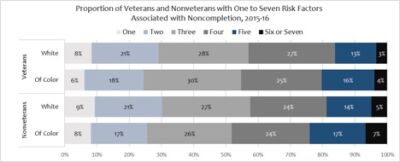
Greater proportions of undergraduate students of color, both veteran and nonveteran, had five or more risk factors associated with noncompletion compared to their white peers. Researchers have identified seven factors, including several demographic characteristics, that can negatively affect persistence and attainment. These risk factors have been used by ED to determine the risk of noncompletion among nontraditional students (i.e., older adults).[17] We used five of these factors plus two others—first-generation student and disability status—to assess the noncompletion risk characteristics of student veterans and nonveterans in 2015-16: The seven risk factors we used are (1) no high school diploma, (2) part-time enrollment, (3) have dependents, (4) single-parent status, (5) working full time while enrolled, (6) have a disability, and (7) first-generation college student.[18]
Although roughly similar proportions of veterans and nonveterans had one to four risk factors associated with noncompletion, undergraduate students of color—both veterans (20 %) and nonveterans (24 %)—exhibit five or more risk factors, higher than that of their white counterparts (16 % and 19 %, respectively). (Figure 9.)
Figure 9
Source: NPSAS: 16.
Note: This figure represents an index of risk based on the sum of seven possible characteristics that may adversely affect persistence and attainment. The seven characteristics are (1) no high school diploma, (2) part-time enrollment, (3) have dependents, (4) single-parent status, (5) working full time while enrolled, (6) have a disability, and (7) first-generation college student. Because veterans are considered independent students for purposes of federal student aid, we compared them to nonveteran independent students.
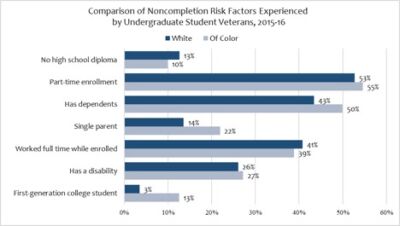
As Figure 10 shows, a greater proportion of veterans of color had five of the risk factors associated with noncompletion compared to their white peers—part-time enrollment, has dependents, single parent, has a disability, and first-generation college student. Among the risk factors, having dependents, being a single parent, and being a first-generation college student stood out for the disparity between white veterans and those of color. For example, undergraduate veterans of color were more than four times as likely to be first-generation students as white veteran students and thus lack the guidance or counseling potentially available to those with family members who had attended college. Similarly, not only were undergraduate veterans of color (50 %) more likely to have dependents than their white peers (43 %), but they were also substantially more likely to be single parents than their white peers.
Figure 10
Source: NPSAS: 16.
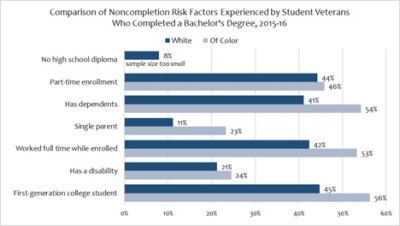
Compared to their white counterparts, a substantially higher proportion of student veterans of color succeeded in earning a bachelor’s degree even though they faced serious risk factors to noncompletion. Indeed, veterans of color who graduated with a bachelor’s degree were 10 percentage points more likely to face key risk factors—having dependents, being a single parent, working full time, and being a first-generation college student—than their white peers. (Figure 11.)
Figure 11
Source: NPSAS: 16.
Cumulative Student Loan Debt
Overall, there was little difference in student loan debt (both percentage of students and amount of debt) between white veterans and veterans of color who earned a bachelor’s degree in 2015-16. However, veterans had less cumulative debt and average debt than their nonveteran peers, which is not surprising given the generosity of the Post-9/11 GI Bill.
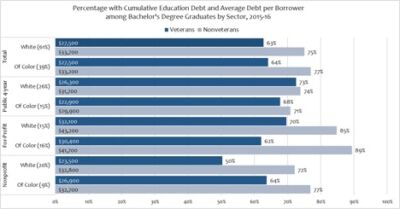
Our sector analysis found similar trends for veterans and nonveterans: The proportion of undergraduate veterans (both white and those of color) with cumulative debt and the average amount of debt per borrower was lower than for their nonveteran counterparts. At for-profit schools, for example, similar proportions of nonveterans who graduated with bachelor’s degrees had student loan debt (85 % of nonveterans of color and 89 % of white nonveterans), with white nonveterans having somewhat higher average cumulative debt than their counterparts who were persons of color—$43,200 vs. $41,700, respectively. In contrast, a lower proportion of both white veterans and those of color who earned bachelor’s degrees at for-profit schools had cumulative student loan debt (62 % and 70 %, respectively) and the average debt amount was substantially lower—$30,400 and $32,100, respectively. Notably, the percentage of veterans of color with cumulative debt was lower than that of white veterans.
In contrast with for-profit schools, public and nonprofit sector institutions were associated with lower average amounts of cumulative student loan debt per borrower for all veterans and nonveterans. However, the proportion of white veterans and those of color with cumulative debt was similar at public and for-profit schools. Among veteran undergraduate students, the proportion of white veterans with cumulative debt was the lowest (50 % had borrowed) at nonprofit institutions, while the proportion of student veterans of color with such debt was the highest at public institutions (68 %). (Figure 12).
Figure 12
Source: NPSAS: 16.
Note: Because veterans are considered independent students for purposes of federal student aid, we compared them to nonveteran independent students.
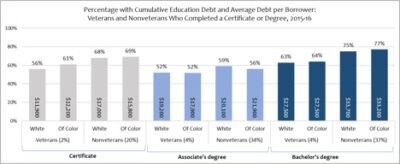
Irrespective of the credential, greater percentages of nonveterans of all races had student loan debt than their veteran counterparts and their average amount of debt was higher. In general, the cumulative student loan debt trends for veterans and nonveterans who earned certificates and associate’s degrees in 2015-16 were similar to their nonveteran peers who graduated with bachelor’s degrees. Although students can generally graduate with a certificate in about 9 months, the percentage of both white veterans and those of color with cumulative student loan debt was higher for graduates with certificates than for graduates of associate’s degree programs, which take about 24 months to complete. This disparity may be related to the fact that, compared to other institutional sectors, more students earn certificates at for-profit schools where greater proportions of students have student loans. (Figure 13.)
Figure 13
Source: NPSAS: 16.
Note: Because veterans are considered independent students for purposes of federal student aid, we compared them to nonveteran independent students.
Conclusions
Although ED survey data provide valuable insights, additional data are needed to better understand the outcomes of veterans of color compared to white veterans and other GI Bill beneficiaries, including institution-specific veteran outcomes; persistence for beneficiaries who are not first-time students; veterans’ eligibility level, which can range from 50 percent up to 100 percent; and whether a veteran not using benefits in the year of the survey had exhausted their benefits or had ever used benefits.[19] Both policy makers and GI Bill beneficiaries need these metrics to better understand the return on investment of the GI Bill, the former for effective oversight and the latter to help veterans make an informed choice. Legislation introduced in both the House and Senate would require the Department of Veterans Affairs to report outcome data for GI Bill beneficiaries. Congress should mandate such reporting.
[1]The Census Bureau follows the U.S. Office of Management and Budget (OMB) guidelines when it collects race and ethnic data, which are self-reported. The OMB race categories are (1) White, (2) Black or African American, (3) Asian, (4) American Indian and Alaska Native, (5) Native Hawaiian and Other Pacific Islander, or (6) some-other-race. According to the Bureau, “ethnicity determines whether a person is of Hispanic origin or not.” In 2000 and 2010, some-other-race was the third-largest race group, primarily due to reporting by Hispanics who may report as any race.
[2]Section 480(d)(3) of the Higher Education Act specifies eight criteria for qualifying as an “independent” student for purposes of Title IV, including veteran or U.S. military active-duty status. However, the Free Application for Federal Student Aid (FAFSAA) eliminated the question on veteran or active-duty status about 10 years ago and as a result, these other factors (age, marital/dependent status) are used to classify students as financially independent.
[3]As noted in methodology, our analysis excluded officers and focused on undergraduate veterans. In general, a bachelor’s degree is a prerequisite for officers, while a high school diploma suffices for enlisted personnel.
[4]According to a July 2019 Census Bureau estimate, persons of color constituted about 40 percent of the U.S. population, a smaller proportion than among nonveterans.
[5]“Other” includes American Indian, Alaska Native, Native Hawaiian or Other Pacific Islander, any other race, and two or more races.
[6]Additional demographic characteristics will be discussed in a later section on the risk factors associated with noncompletion.
[7]There are several possible explanations for why veterans may not be using GI Bill benefits in a given academic year, including that they (1) did not meet the eligibility requirements, such as a minimum number of months of service or did not receive an honorable discharge; (2) exhausted the typical 36 months of benefits; (3) enrolled in college part time or only took a few courses; (4) relied on other student aid; and (5) enrolled in a low-cost community college to save the GI Bill for a bachelor’s degree.
[8]NPSAS captures use of benefits only during the year of the survey, not whether veterans ever used the GI Bill.
[9]The distribution of white and undergraduate veterans of color using benefits is shown beneath each bar in Figure 3B. After the 1st year of enrollment, the distribution steadily declines to just 1 percent for both white and veterans of color from 23 percent and 16 percent, respectively, reflecting attrition by graduates or those who left without a credential.
[10]In general, GI Bill benefits cover 36 months of school, the equivalent of four 9-month academic years. The median time taken to earn a bachelor’s degree varies considerably by students’ demographic characteristics. According to ED data, the median number of months for all bachelor’s degree graduates is 52 months (just over 4 years). However, the median is 64 months for African Americans and 84 months for independent students. As noted earlier, veteran undergraduates are typically financially independent from their parents.
[11]We analyzed the persistence and attainment of white undergraduate veterans and nonveterans and those of color who enrolled in college for the first time in 2011-12 using BPS because NPSAS reports completion for the year of the survey but not persistence after initial enrollment.
[12]It is important to note that, because white veterans were more likely than veterans of color to be still enrolled (14 % versus 4 %, respectively), the proportion of white veterans who earn bachelor’s degrees may have increased.
[13]The sample size was too small to analyze outcomes for veterans of color at nonprofit institutions.
[14]A 2014 blog by Ben Miller made a similar point. See Ben Miller, The College Graduation Rate Flaw That No One’s Talking About (Washington, D.C.: New America, October 2014).
[15]Walter Ochinko and Kathy Payea, Association of Career Education Colleges and Universities: Outcomes at Selected Member Schools (Washington, D.C.: Veterans Education Success, December 2018). See p. 13 at this link.
[16]The Chronicle of Higher Education found that of the more than 1,230 campuses that closed from 2014 through 2018, 88 percent were operated by for-profit schools, and they accounted for 85 percent of the students displaced by closures in the past 5 years. Michael Vasquez and Dan Bauman, “How America’s College-Closure Crisis Leaves Families Devastated” (Washington, D.C.: The Chronicle of Higher Education, April 2019).
[17]See Dani Molina and Andrew Morse, Military Connected Undergraduates: Exploring Differences Between National Guard, Reserve, Active Duty, and Veterans in Higher Education (Washington, D.C.: American Council on Education, November 2015).
[18]We did not use two factors: (1) financially independent (most GI Bill-eligible veterans are no longer dependent on their parents), and (2) delayed enrollment (most veterans “delay postsecondary enrollment by more than 12 months” because they were on active duty for several years after high school and may not have begun using their benefits immediately after separation from the military).
[19]Only beneficiaries who served at least 3 years on active duty are eligible for the full benefit, referred to as the 100 percent eligibility level. Tuition payments, living expenses, and book stipends for individuals not 100 percent eligible range from 50 to 90 percent of the full benefit.
VOCReportFNL